Photo Histogram: Part 2
Are you confused, or maybe even a little intimidated by the photo histogram? In the second video of this three part series, I explain how to use the data from your camera’s histogram display to correct your exposure.

Spread the joy! Share today’s tweetable!
Did you miss it? Watch Part 1 in this video series first.
If you want to know more about histograms, and see more histogram examples, check out what is a histogram, interpreting the digital photography histogram, and histogram examples.
Video Transcript
Are you ready to learn more about how to use your camera’s histogram display? Hi, I’m Julie from Ultimate Photo Tips. Last week, I brought you part 1 in this series about histograms, and I covered the basics of understanding and interpreting your histogram. This week, I want to show you how you can use that information to correct your exposures. Let’s jump right into looking at some more examples.
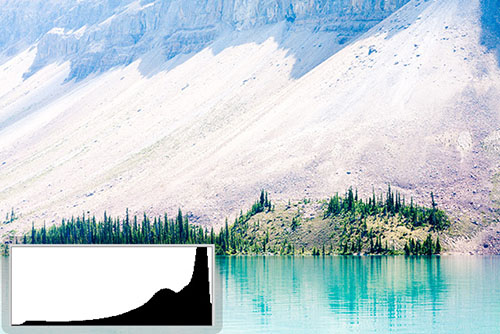
In this first landscape, you can see that the photo histogram goes all the way to the right edge, and there’s a spike right at pure white. We refer to this as the histogram being clipped. It means you’ve lost detail in the whites (we sometimes say the whites are "blown out"), and this is not recoverable later in software. You need to correct it in the field and re-shoot the image. So what do you do if you see this kind of photo histogram? It means your image is too bright, and that you have too much light. That means you need to reduce your exposure, either by using a smaller aperture or a faster shutter speed.
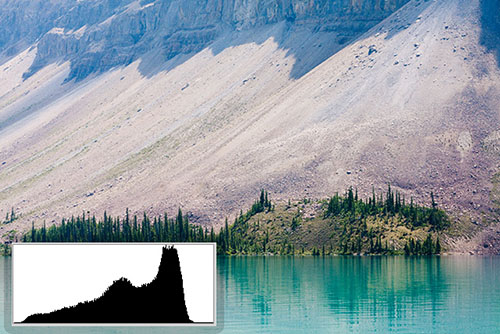
Here, I’ve reduced my exposure by 1 stop, and the histogram is no longer clipped. If your histogram is clipped on the left, it means you’ve lost detail in the shadows (we sometimes say the shadows are blocked up). To correct that, you need to add light to your exposure with a wider aperture or longer shutter speed.
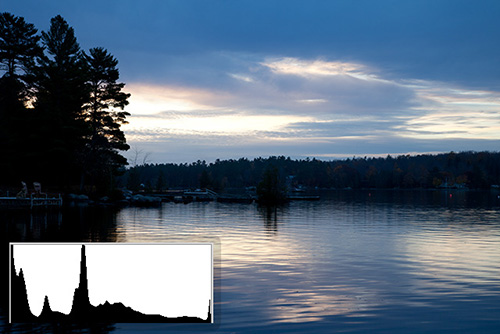
Now what about this instance? I have both dark shadow and bright highlights in the same image. Here, my photo histogram is clipped on both ends. This means that the dynamic range of the scene is too great to be captured by your sensor. If I try to correct the darks by adding light, I just make the whites worse, and vice versa.
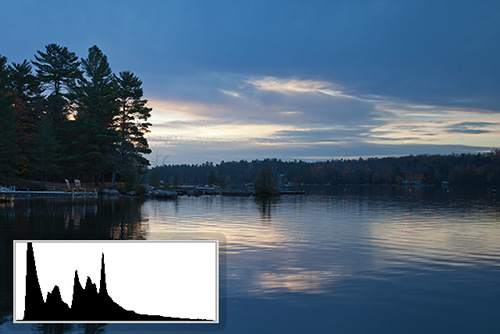
The only way to deal with this is to create an HDR image, which means making several exposures – some that correctly capture the shadows, and some that correctly capture the highlights, and then merging them together in software. This is the result. And here’s the histogram. Remember, our eyes can see much more than our camera’s can.
Now, all of the histograms that I’ve been showing you have been what’s called "luminosity" histograms that show the averaged brightness levels in the image for all three color channels. Your camera can also split this out into an "RGB histogram" that shows the brightness for each of the red, green and blue channels separately. When would you want to use that?
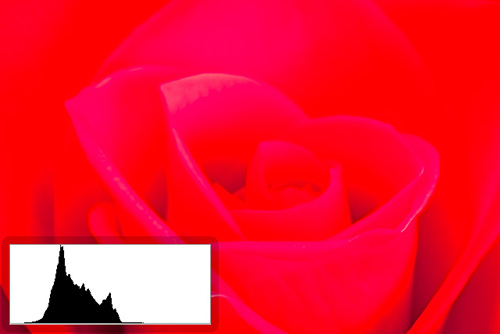
Here’s an example where I have a completely red image. If you see just the luminosity histogram, it looks like the image may be under-exposed. Certainly, it seems like I could increase the exposure without blowing out any highlights.
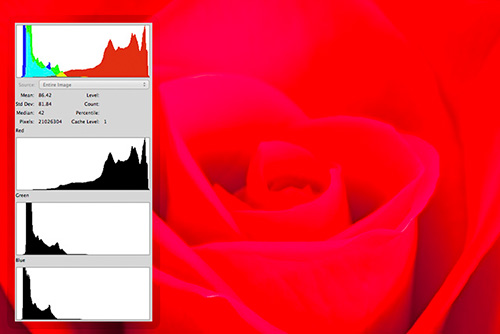
However, when I show you the RGB histogram for the image, you can see that the reds are right at the right edge. If I increased the exposure, I would blow out the red channel. That means that I’d lose detail in the reds. That’s why, when you’re photographing something in a single color, the luminosity histogram can be deceptive since it’s showing an average of the brightness levels across all channels. Displaying the RGB histograms separately gives a more accurate picture of what’s going on.
That’s enough for today! Next week, I’ll have the final part in the photo histogram video series. It’s a tip for those of you shooting in RAW mode called "exposing to the right." It’s a way to use your histogram to help you maximize the amount of data and detail your camera is capturing. Stay tuned!
For this week, if you want to see more examples, make sure you check out the other photo histogram pages on ultimate-photo-tips.com, linked below this video.
Happy shooting and I’ll see you next time!
If you want to know more about histograms, and see more histogram examples, check out what is a histogram, interpreting the digital photography histogram, and histogram examples.