What is a Histogram?
What is a histogram? Understanding Histograms is essential for the digital photographer. Learn more about these tools, how to interpret them, and how they can benefit your photography.
The Histogram
Don’t be intimidated by histograms! Understanding histograms is very easy, and they are a great tool for giving you, the photographer, useful information about your image.
A histogram is simply a graph. It’s actually a bar chart, which plots distributions. Each bar represents a category, and the height of the bar represents how many items fall into that category.
The example below shows a histogram describing the population of NY county. Each bar represents an age range, and the height of the bar represents how many people fall into that age range.
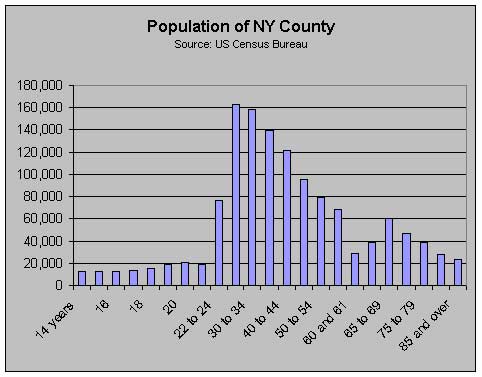
Population histogram
Image Histogram
What is a histogram in photography terms? An image histogram is similar to a population histogram. This time, the bars in the graph show where all the brightness levels contained in the image are found, from the darkest to the brightest.
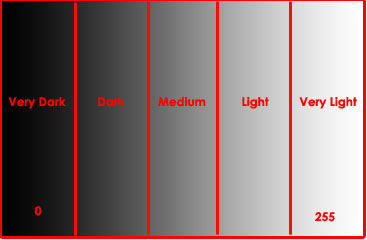
Image histogram “categories”
Bars on the left represent very dark pixels in the image, with bars all the way to the left representing pure black pixels (0). Bars at the right represent very light pixels, with bars all the way to the right representing pure white pixels (255). Bars in the middle represent mid-tones. The height of the bars represents the total number of pixels at that brightness level. An image histograms, therefore, shows an image’s overall exposure.
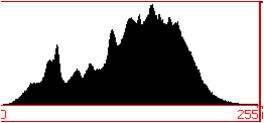
Example image histogram
Image source: dpreview.com
In the next section, I explain how to interpret the digital photography histogram to find out what different shaped graphs mean about your image, and what you need to do to correct your image if your histogram indicates a problem.
Next, you may want to visit another digital photo tips page to learn how to interpret the digital photography histogram.